Finding and Viewing Issues
When you first start Ship, you will see the overview window:
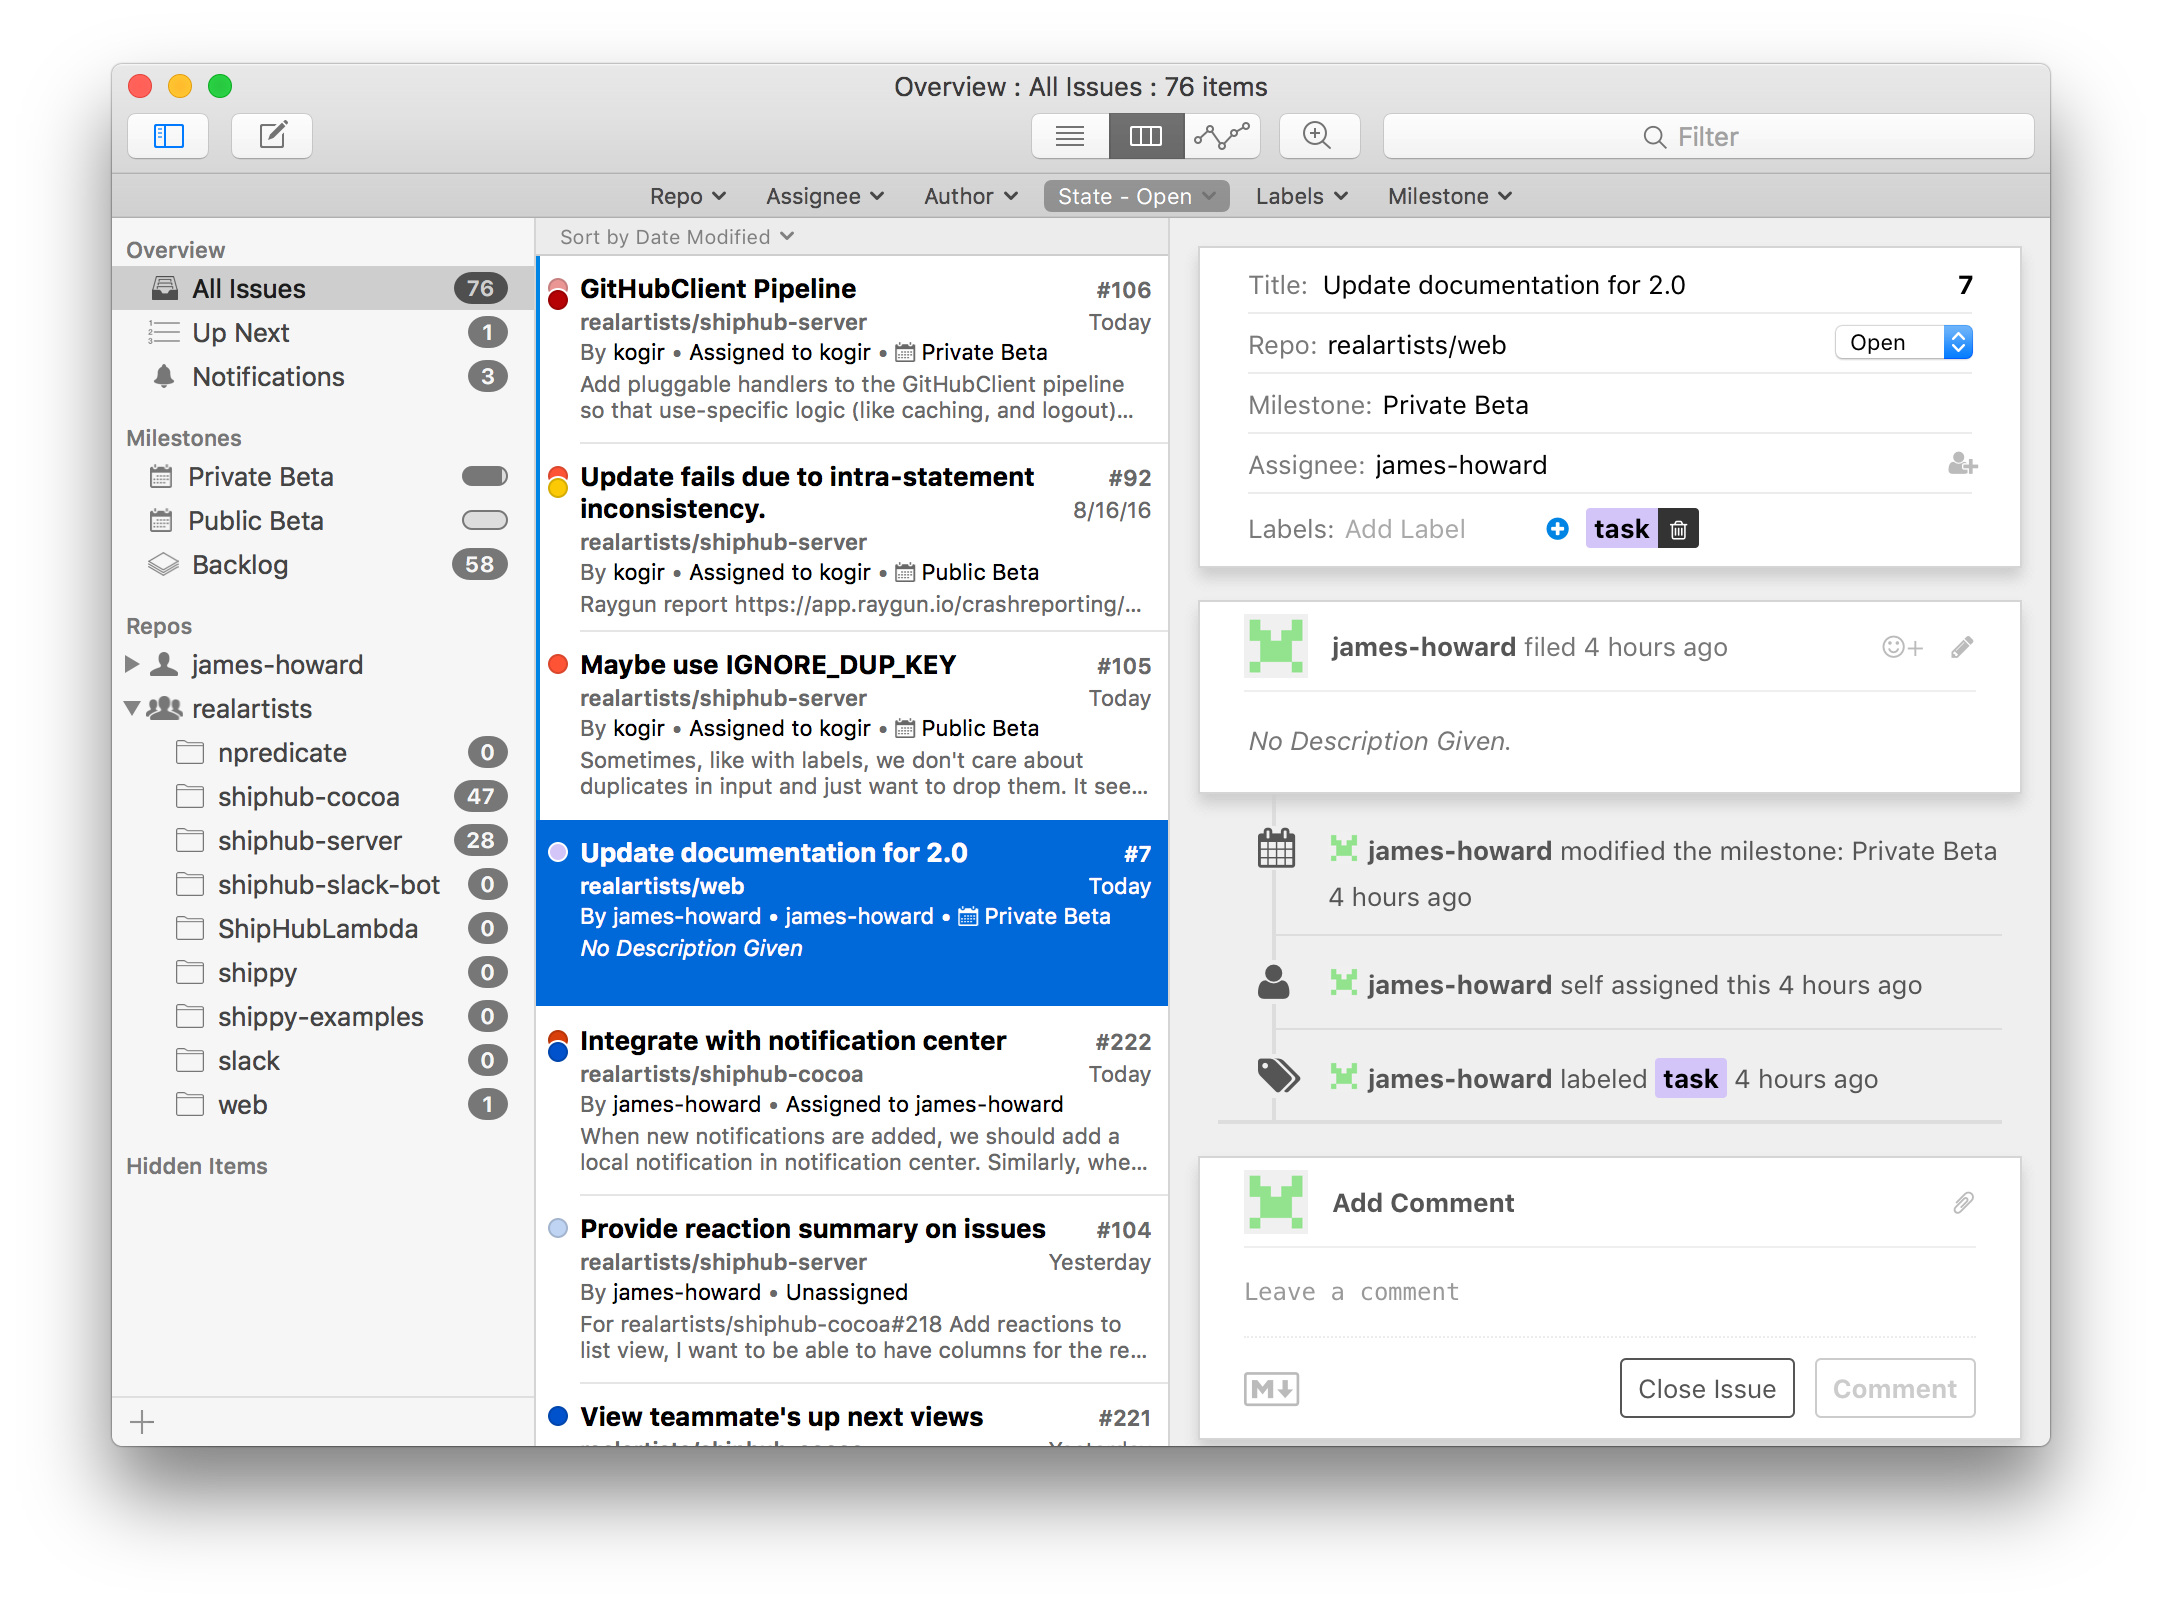
Using the view mode buttons in the toolbar, you can view the same data in 2 additional ways to the browser mode shown above.
List View
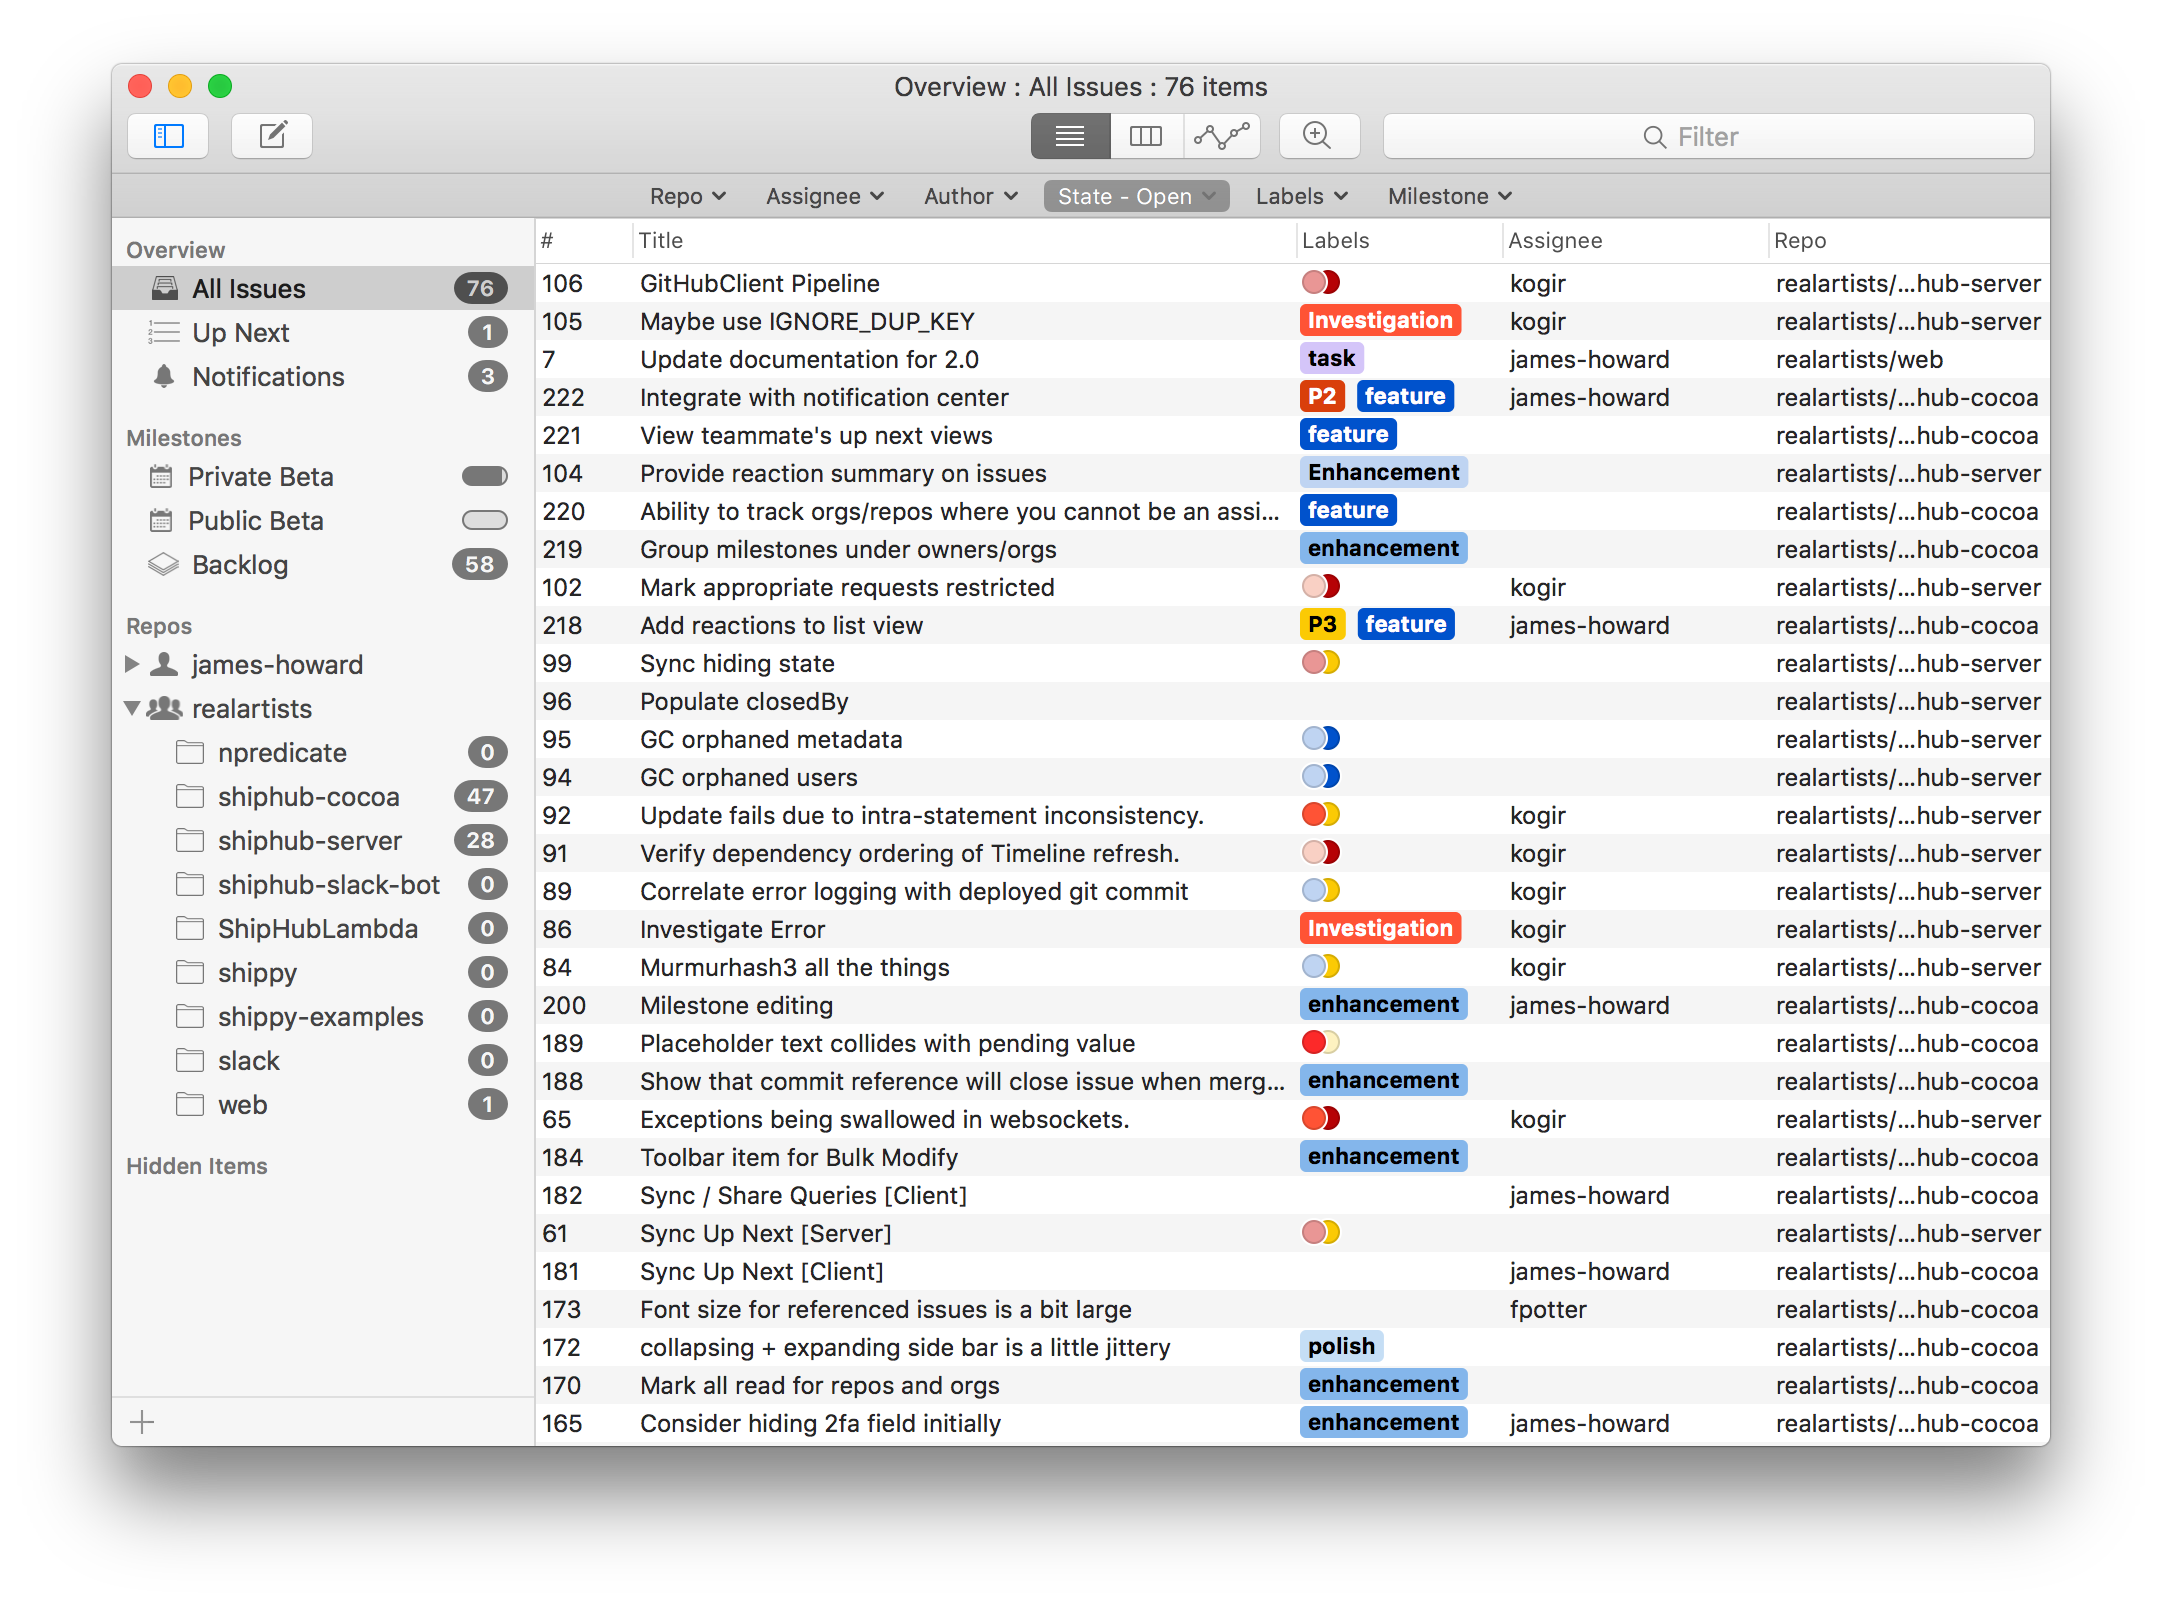
Note
You can sort by any dimension by clicking on the list view column headers. The columns displayed can be customized by right clicking on the list view column header.
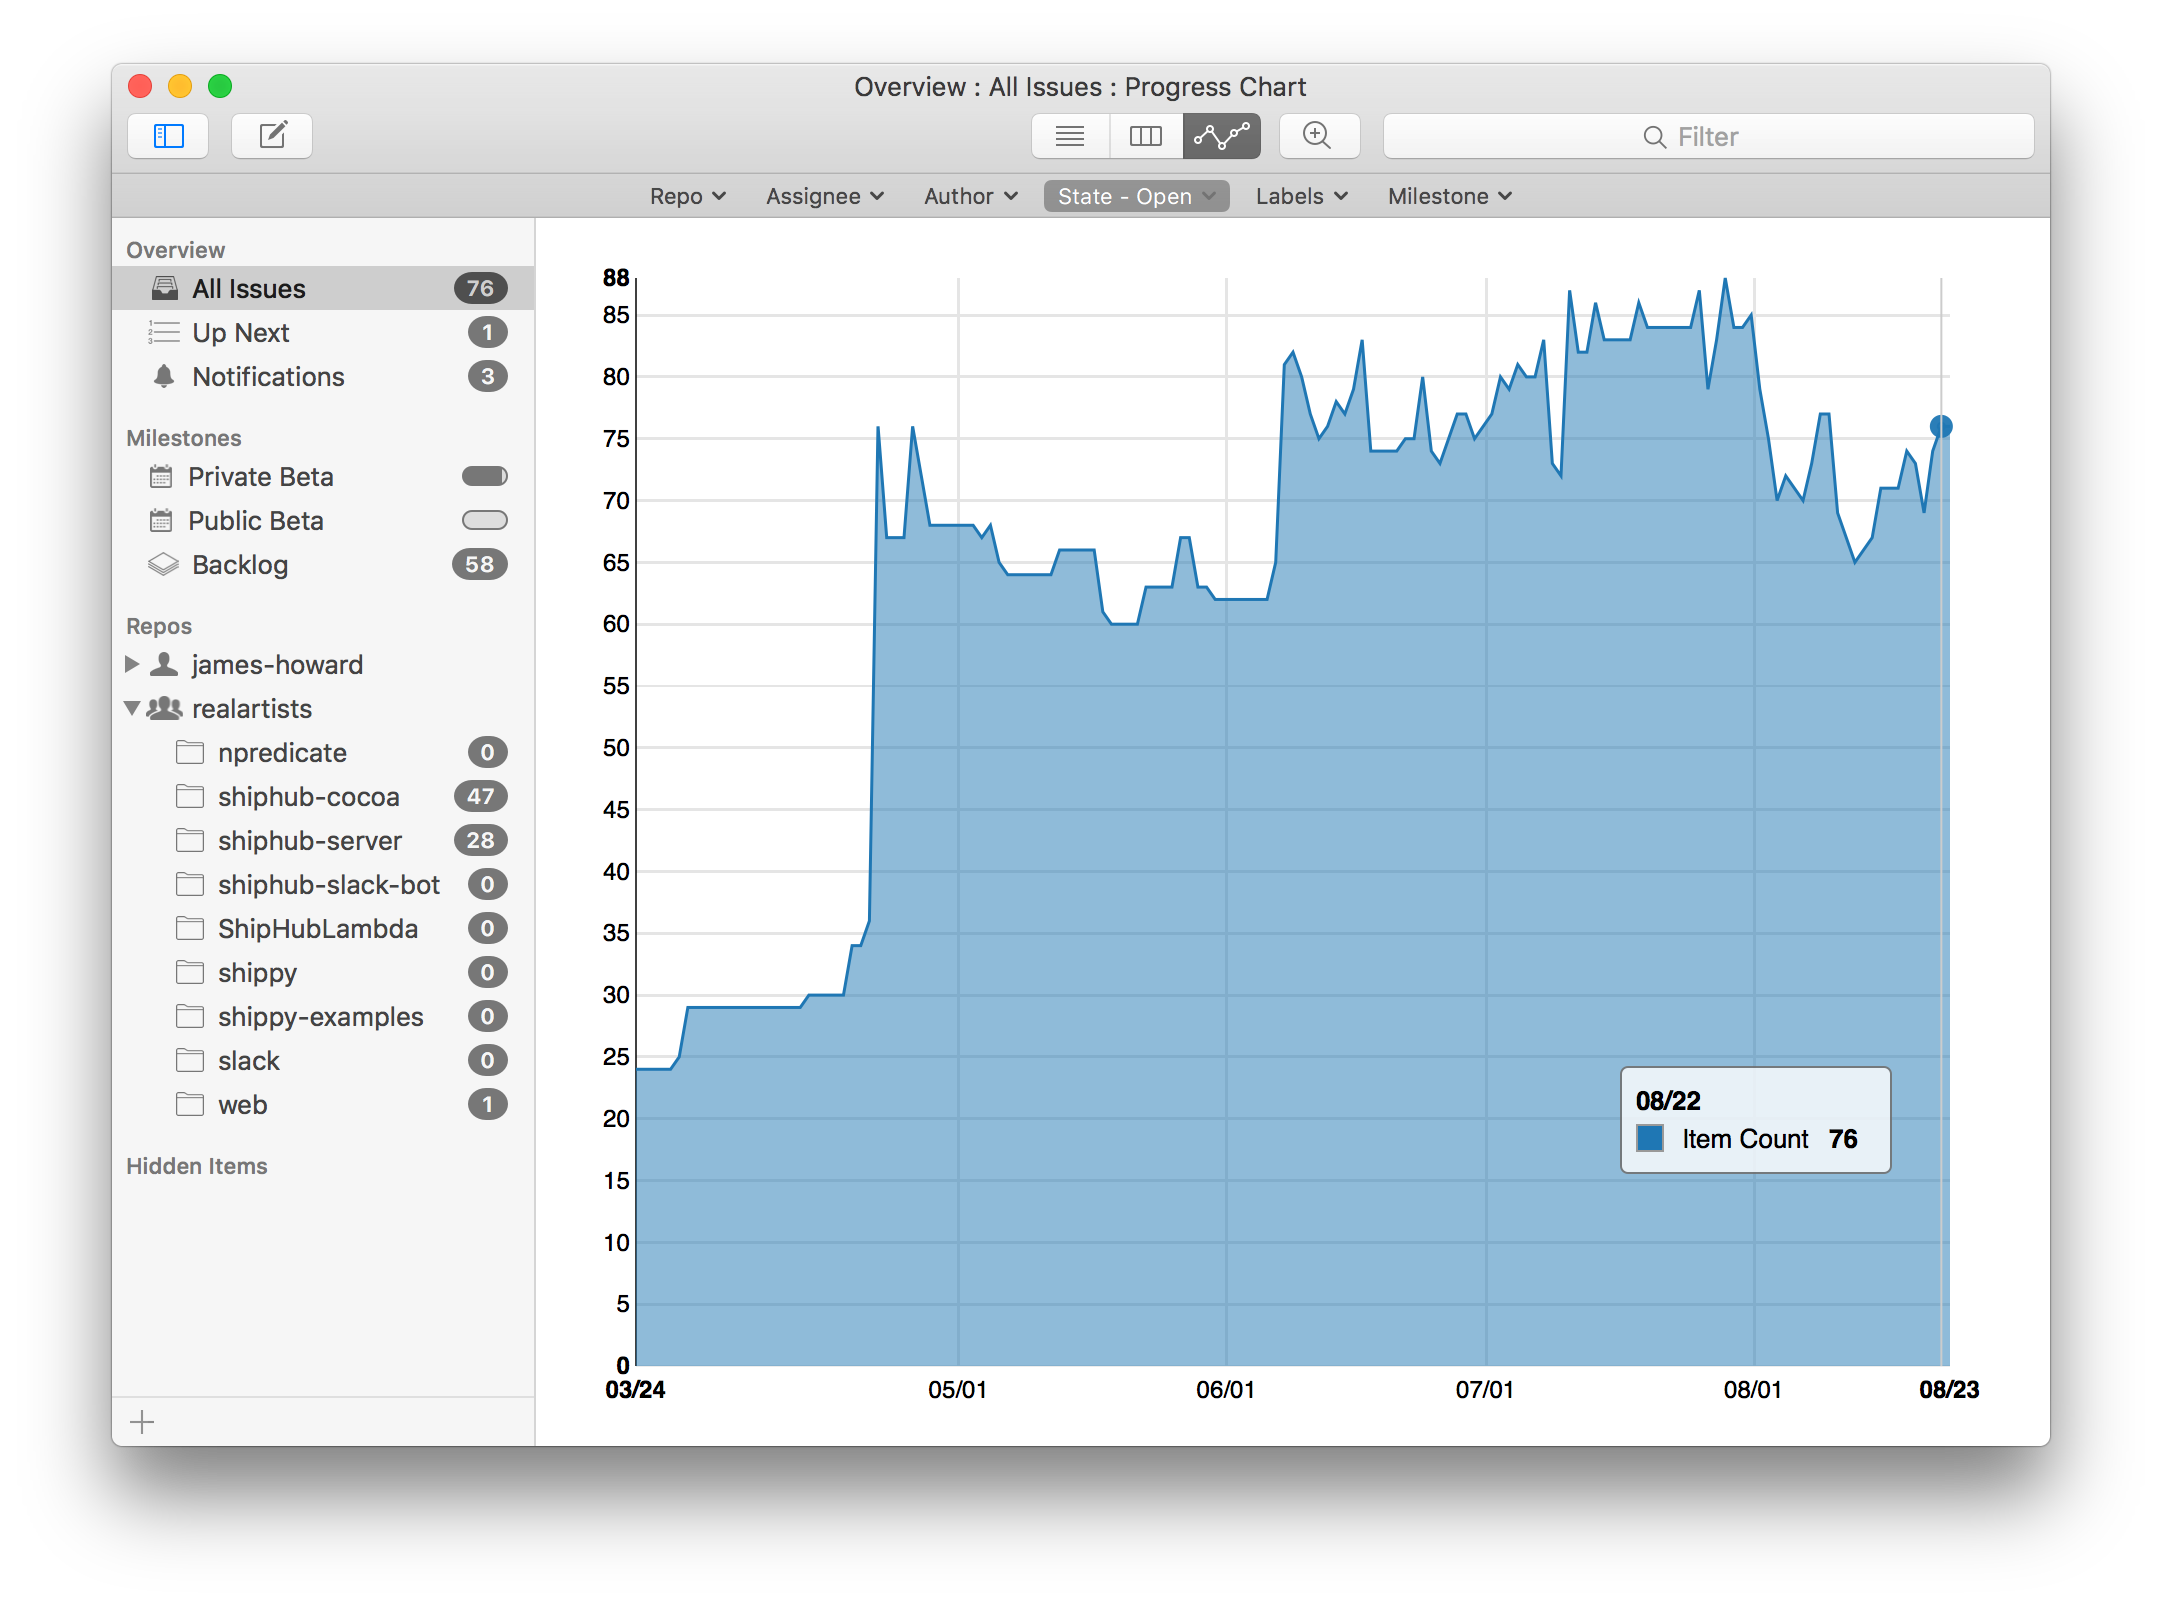
Chart View
Going back to the initial “browser view” in the overview, it is helpful to understand how each area of the overview relates to one another. The following sections will explain the simple conceptual model to the entire Ship overview, that once understood will allow you to very quickly find exactly the data you’re interested in.
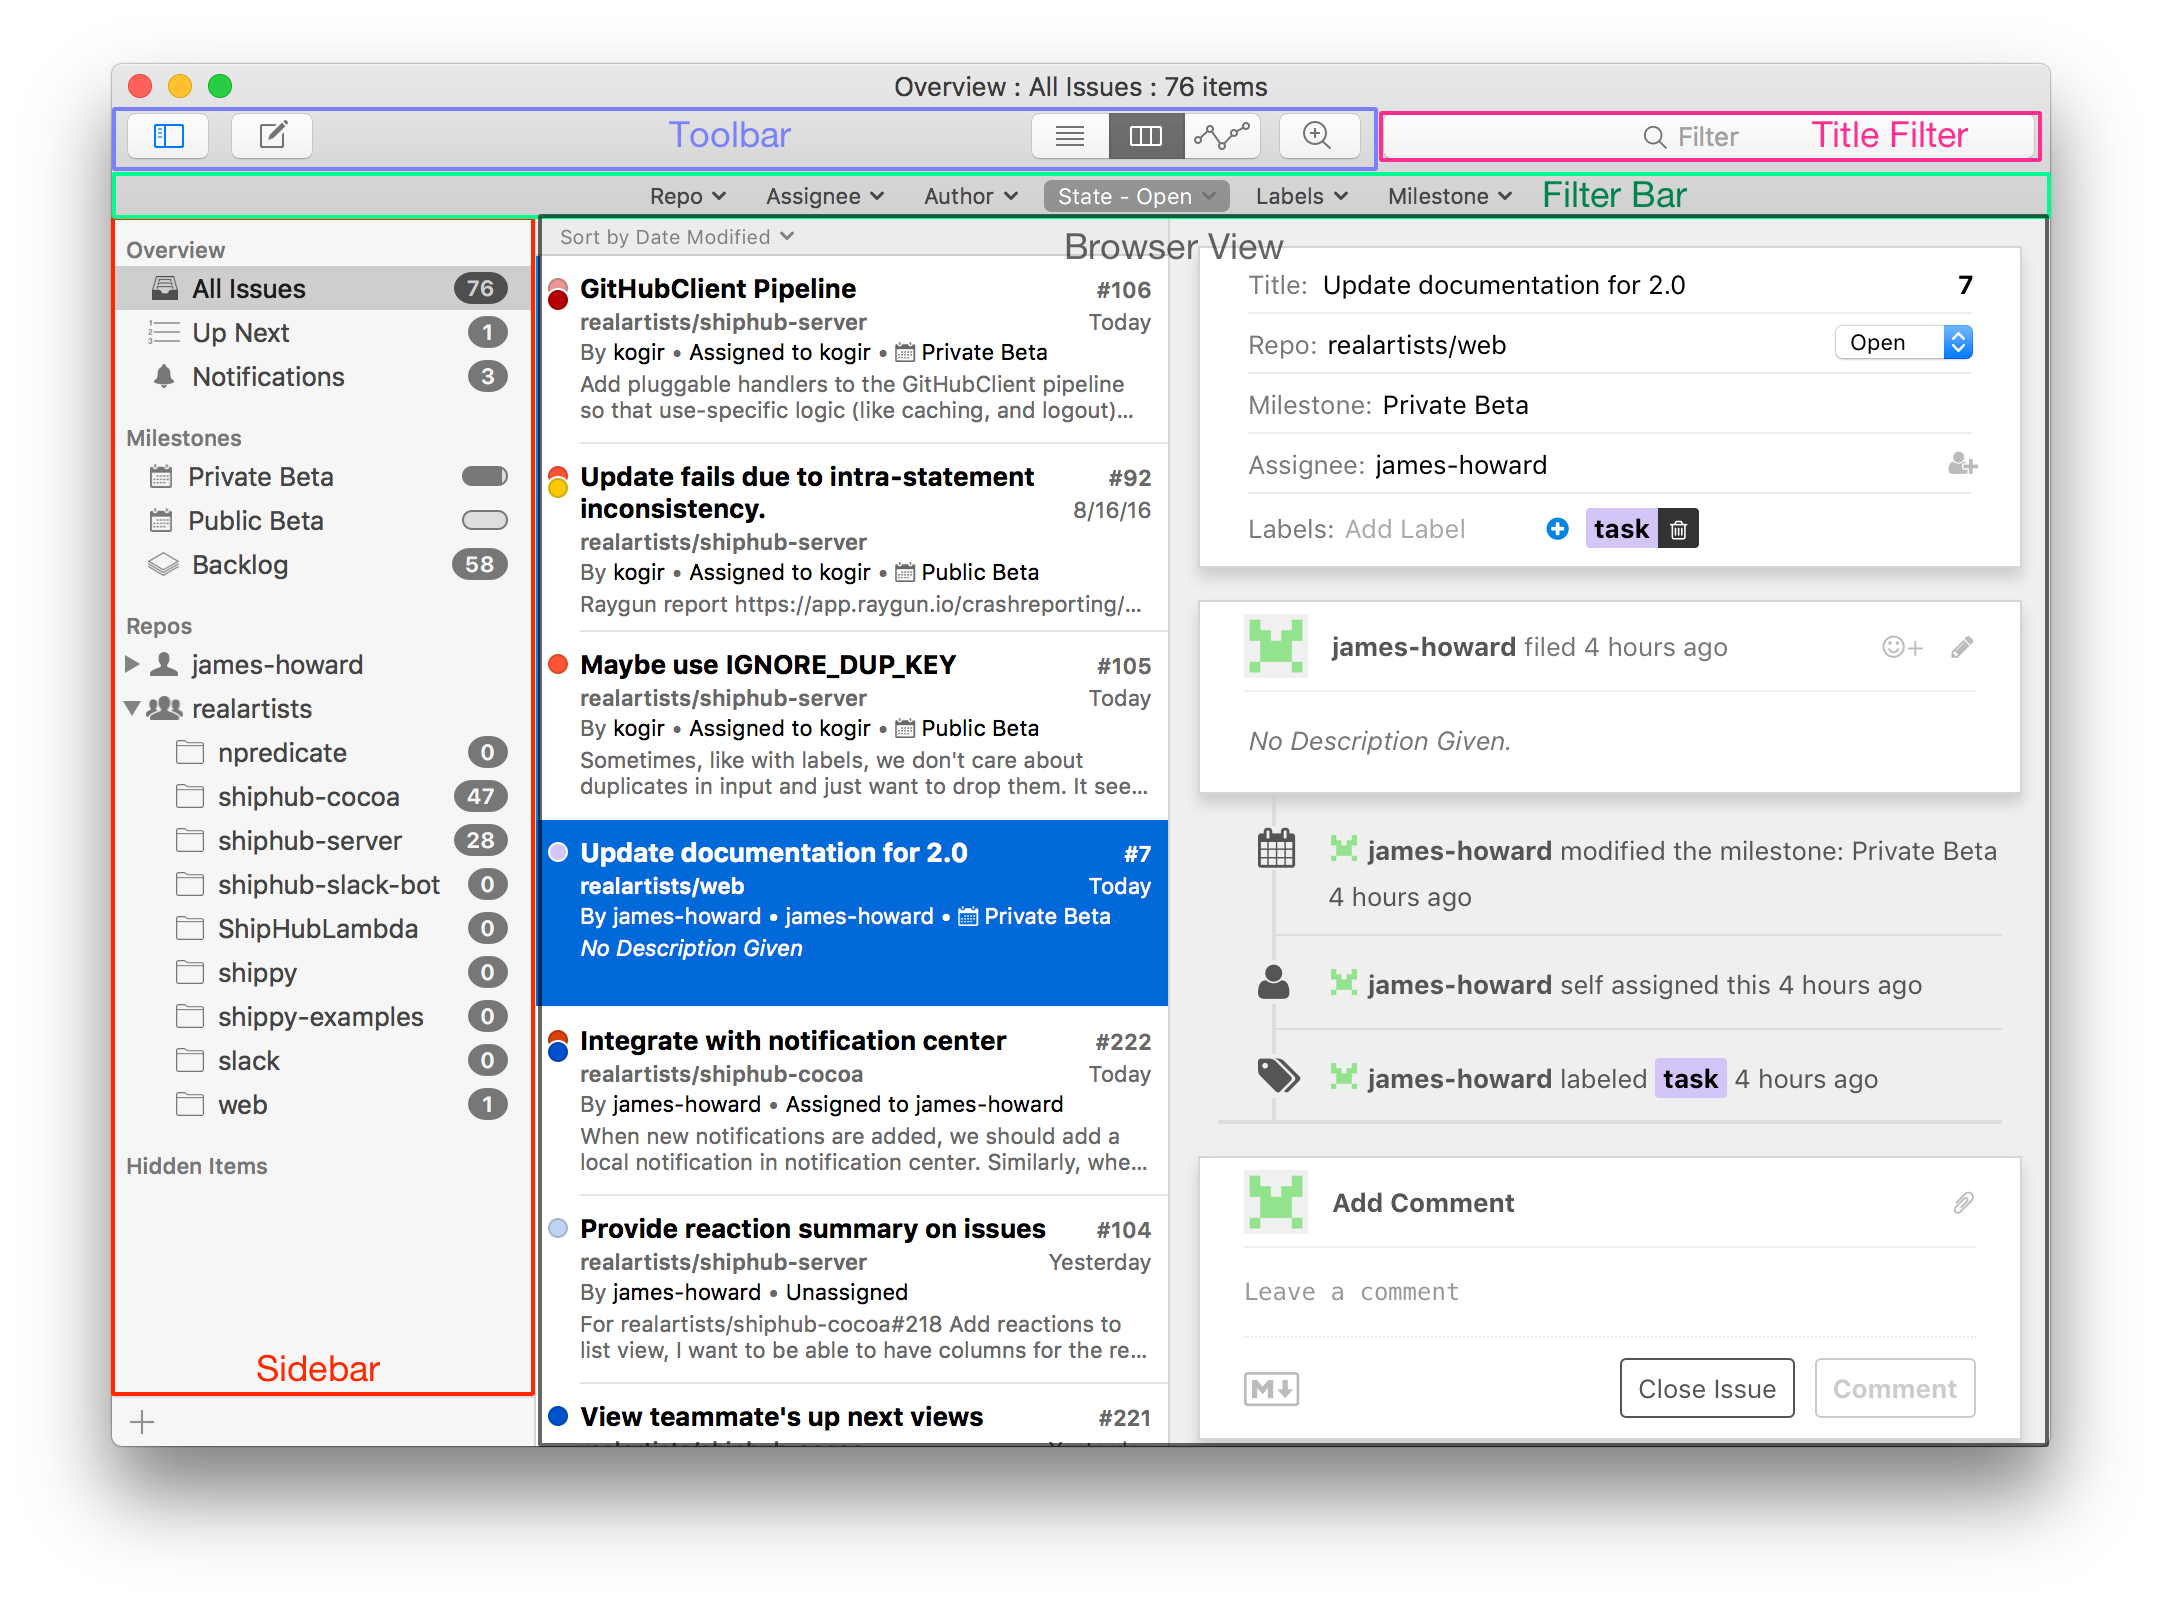
The Sidebar
The items in the sidebar provide an initial scope for your issues.
- All Issues is everything across all of your organizations and repos.
- Up Next is a personal queue where you can keep your todo list.
- Notifications are any issues you’ve subscribed to (either manually, by a repo/organization wide rule, or by being mentioned) that have unread changes.
- Milestones are all of your active milestones.
- Repos is a hierarchical listing of all of your repos. Choose a repo owner or individual repo to view just the issues in that organization or repo.
- Smart Queries (not pictured) are issues matching an advanced query that you can build.
When you select an item in the sidebar, the set of issues shown in either the browser, list, or chart view on the right side of the overview window will be restricted to the scope corresponding to the selected sidebar item.
The Filter Bar
The filter bar allows you to quickly further refine the issues you are viewing. You can interactively drill down by any combination of repo, assignee, author, state, labels, or milestone. Additionally, the title filter in the toolbar lets you quickly filter issues by title.
The set of issues shown in the overview is a function of the intersection of the sidebar item and the filter bar state. In another way of putting it, items in the sidebar define a predicate that match issues, and the filter bar defines yet another predicate, and the actual set of issues displayed is the result of AND-ing those two predicates.
Note that the filter bar intelligently limits its options according to what is selected in the sidebar. So if you already have a repo selected, the repo filter bar button will be hidden, and the set of assignees and labels will correspond to the selected repo.
Hiding Issues from Ship
Ship is designed to be able to show you every issue in all of your repos, but sometimes you’re a member of an organization whose issues you don’t care about, or a certain repo’s issues are not your problem, or a milestone doesn’t apply to you.
In this case, you can right click (ctrl click) on an organization, repo, or milestone in the sidebar and choose the menu option to hide it. When you hide an organization or repo(s) from Ship, Ship will pretend like they don’t exist. It won’t show them in the sidebar, and it won’t display their issues in any view.
To bring back hidden items, simply expand the Hidden Items section in the sidebar and right click (ctrl click) to show the menu to unhide them.
Smart Queries
Choose File → New Smart Query (⌥⌘F) to access the query builder.
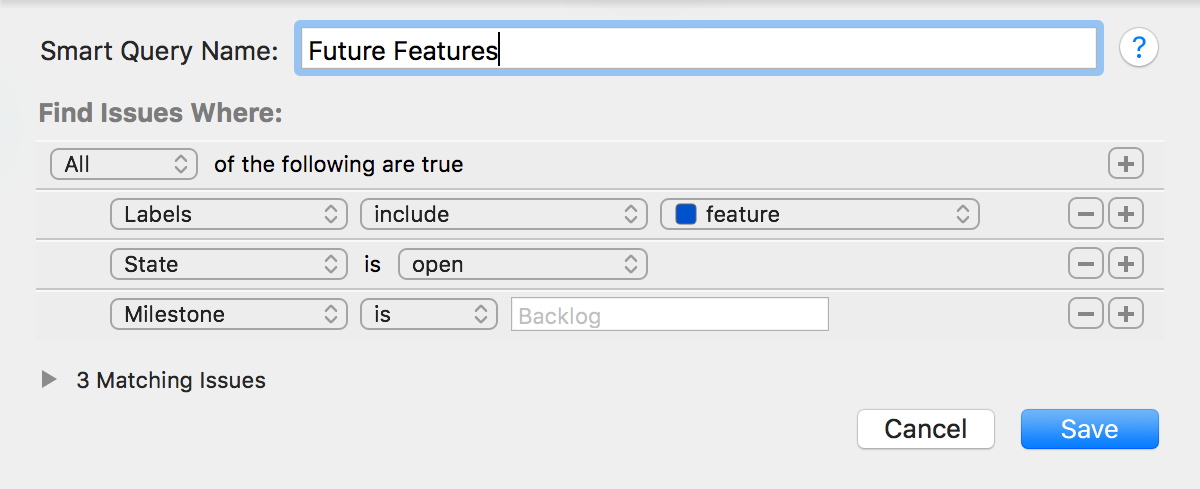
Using the query builder, you can define almost any set of criteria on your Issues you like. You can then save the critera as a Smart Query and it will appear in your sidebar. This is a great way to stay on top of the issues that are most important to you.
Tip
You can share Smart Queries with your team. Ctrl-click or right click on a Smart Query in the sidebar of the Overview window, and choose Copy URL. A link will be placed on your clipboard that others can follow to open your query in Ship.
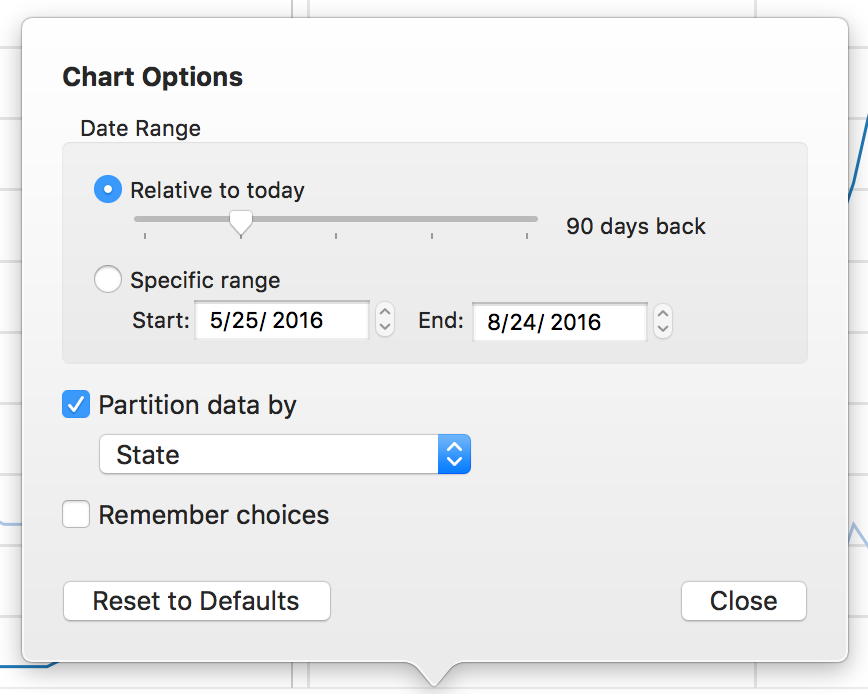
Charting Issues
The chart view displays the number of issues matching the current filter criteria plotted over time. This can be used to show convergence charts towards any goal you can define, but it can also be used for much more.
By bringing up the chart options with View → Chart Options… (⌥⌘,) , you can change the date range, and more importantly, you can apply a partition on the chart data. This makes it easy to compare totals and rates of change of issues across many metrics.
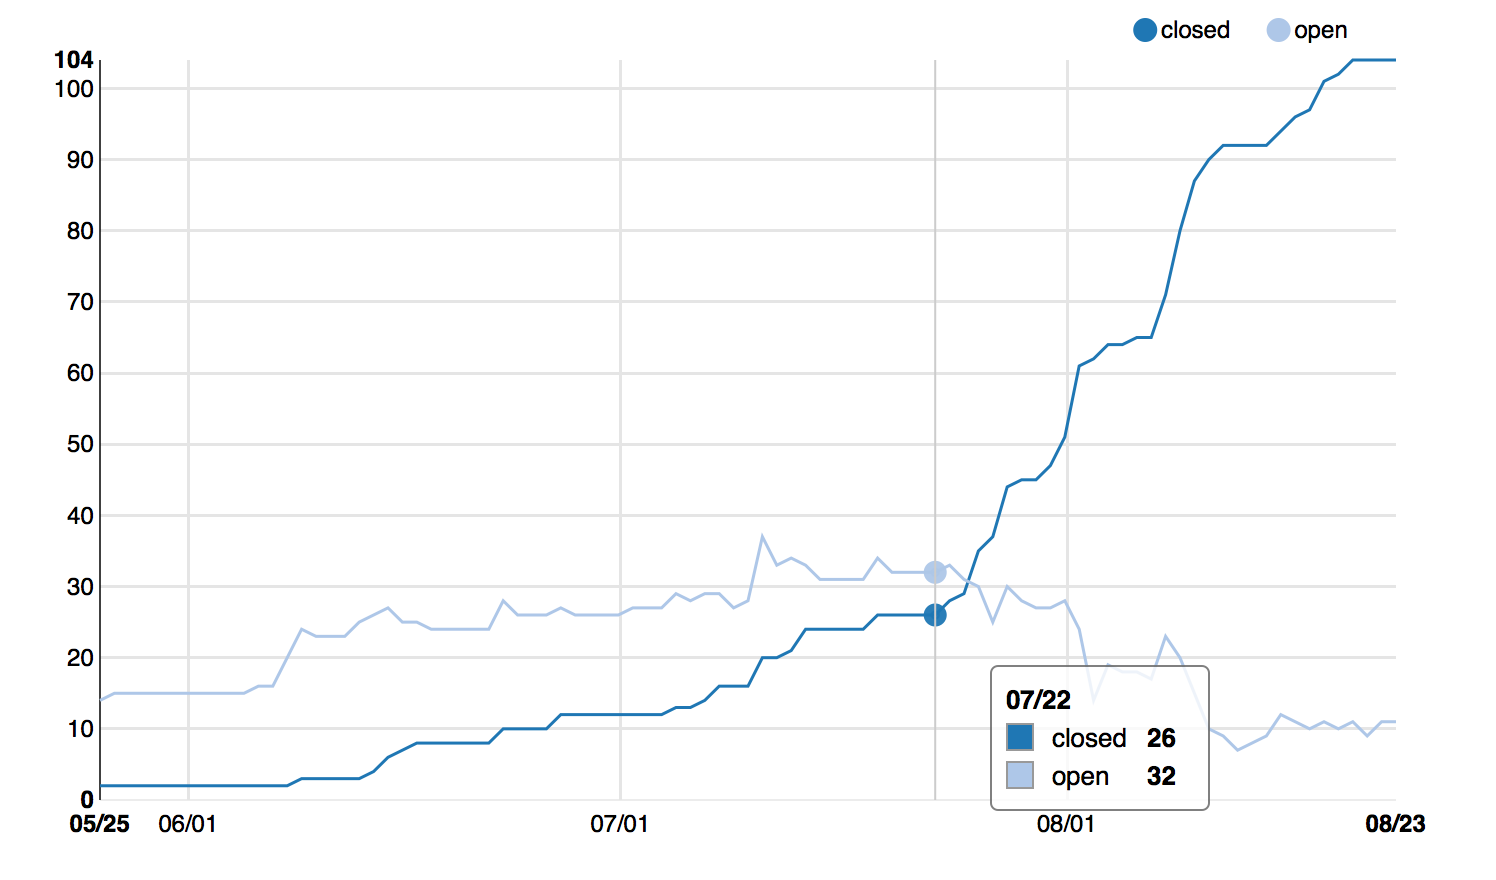
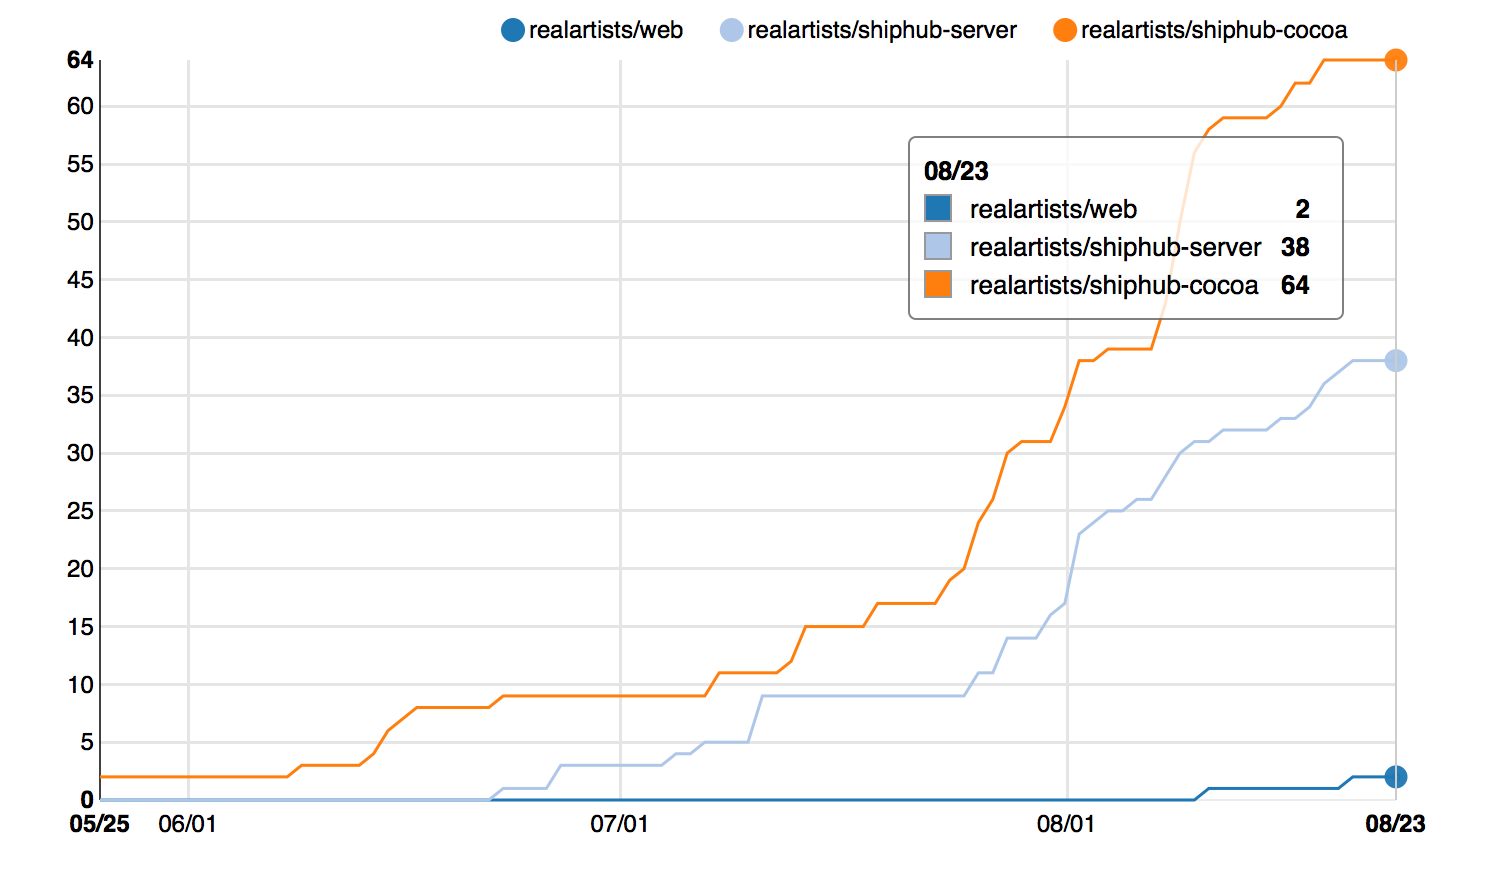
Here are some examples:
Open vs closed issues
Closed issues by repo
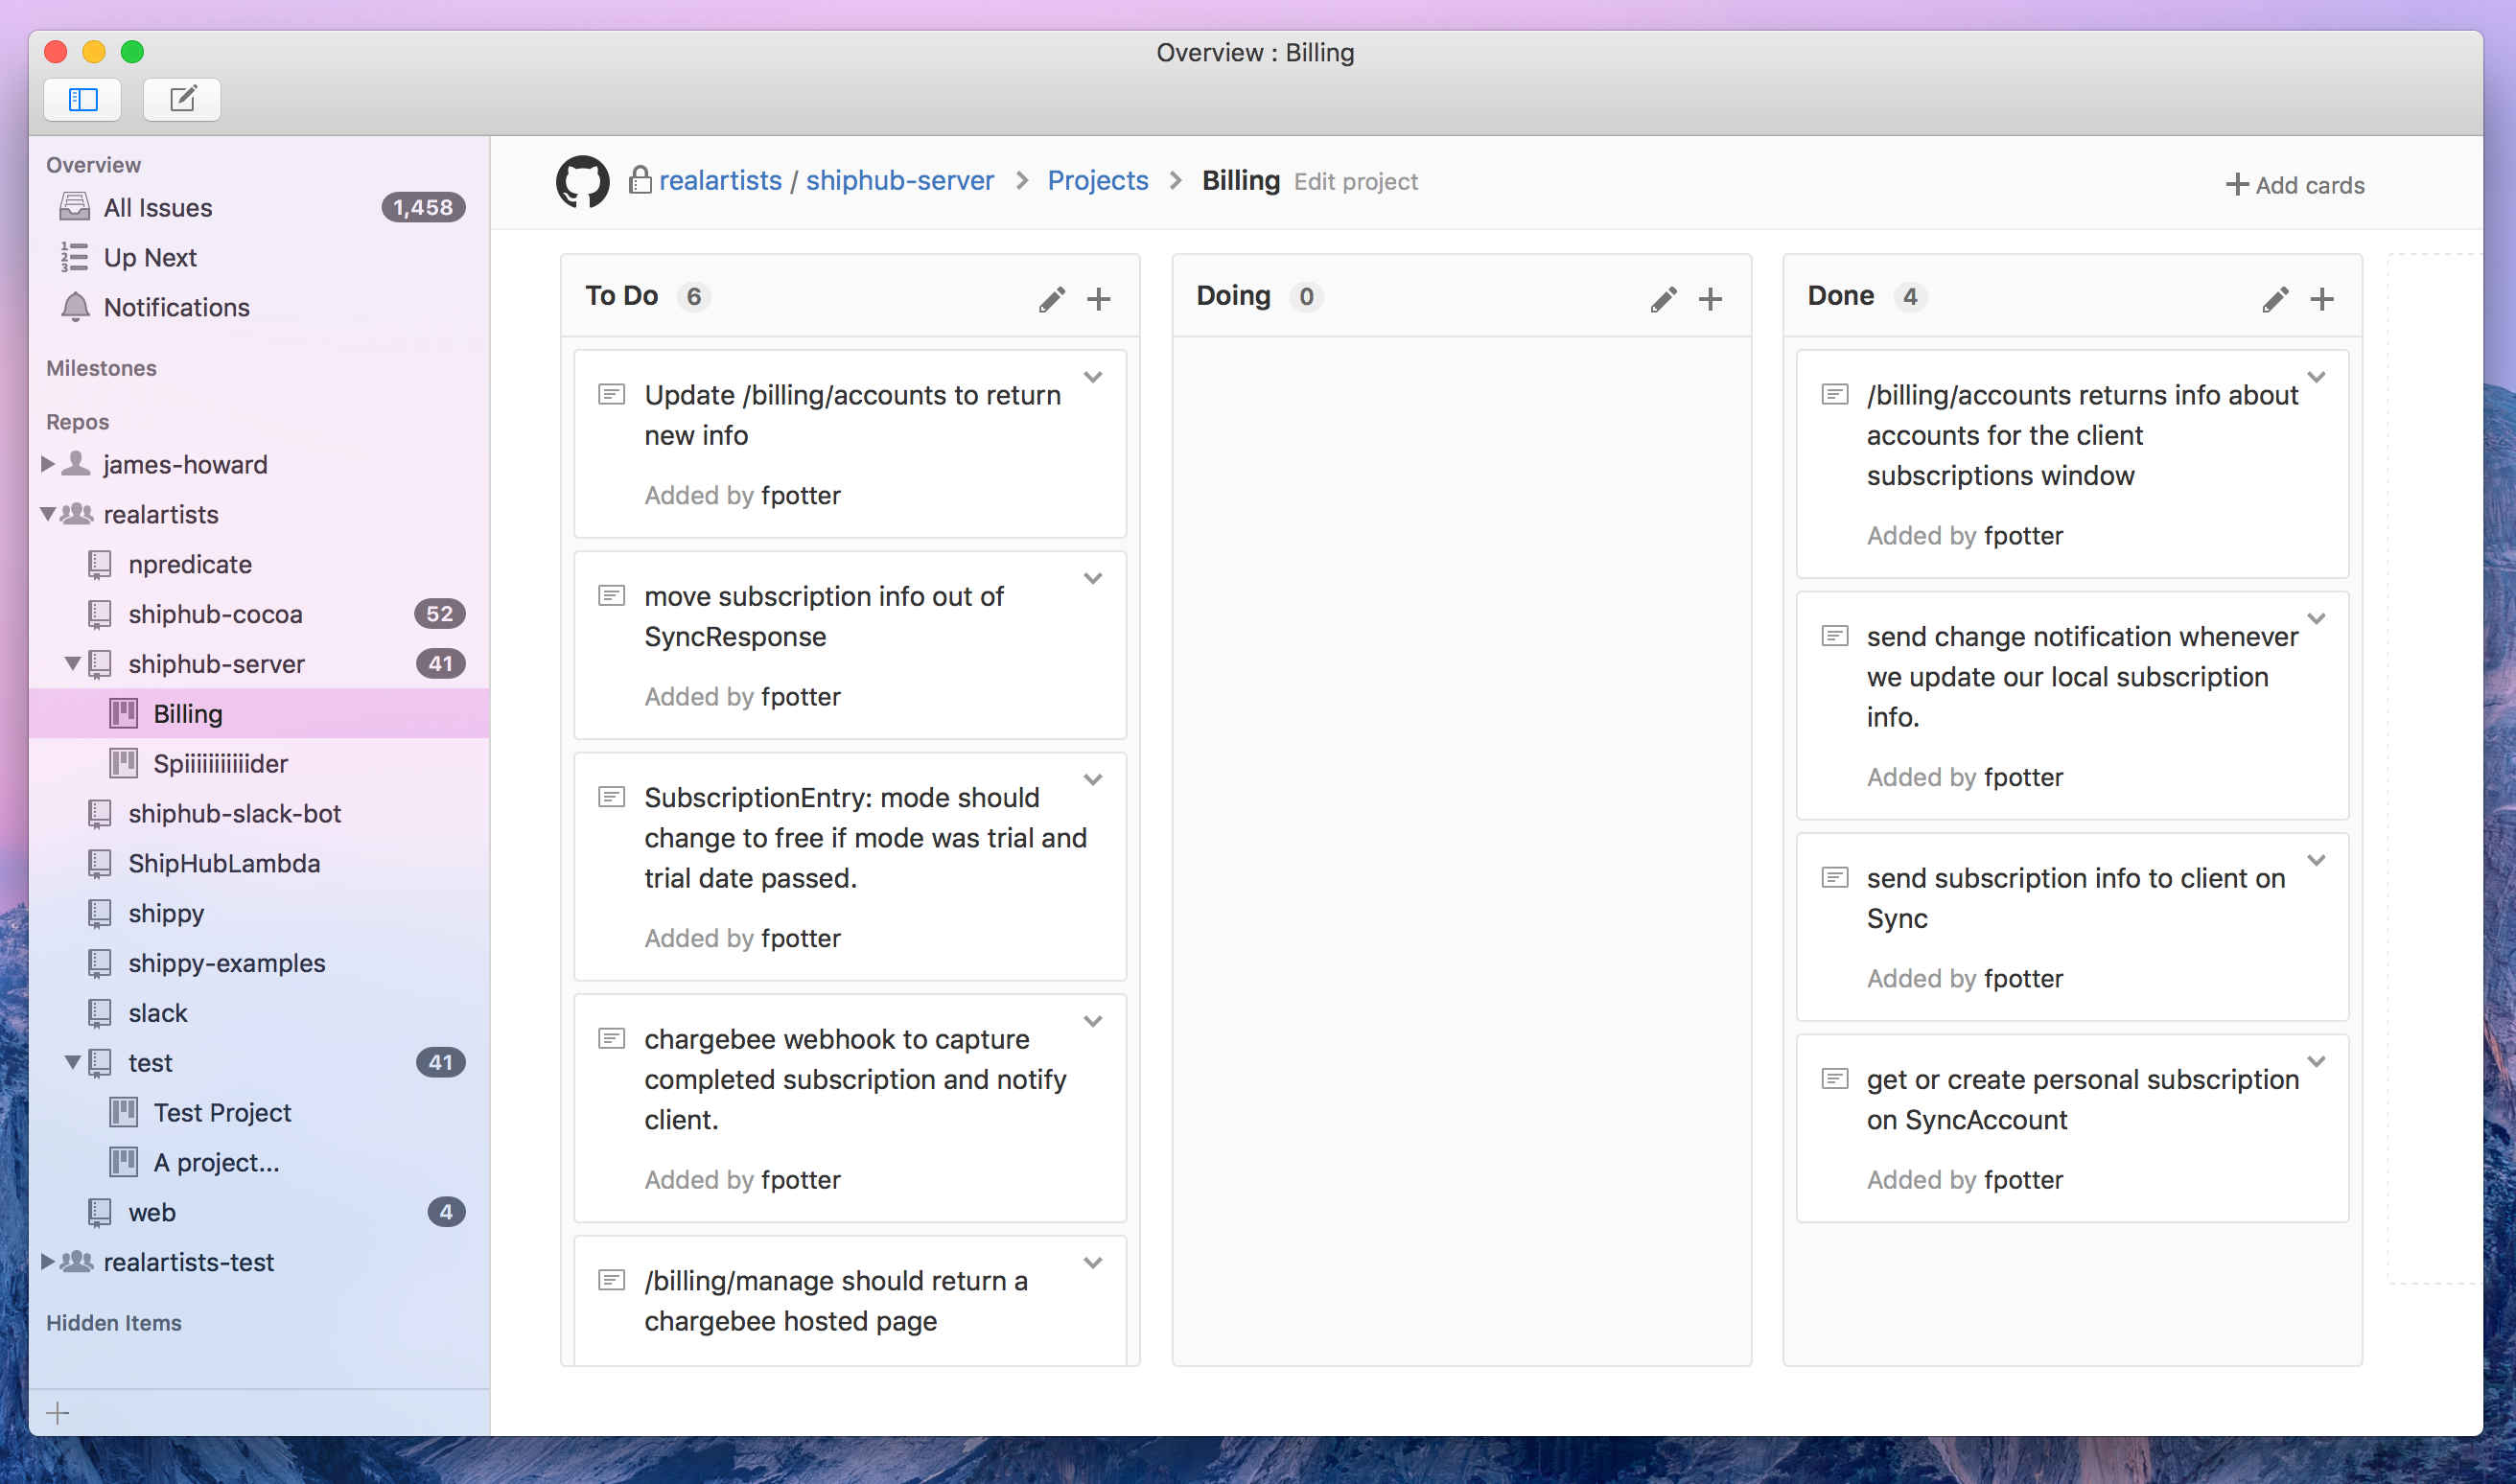
Using GitHub Projects
GitHub Projects allow you to track issues and notes in a drag and drop kanban style board. Ship provides integration with projects by allowing you to create, view, and update projects directly within the Overview window, and any linked issues in your projects will be viewable and editable in Ship.
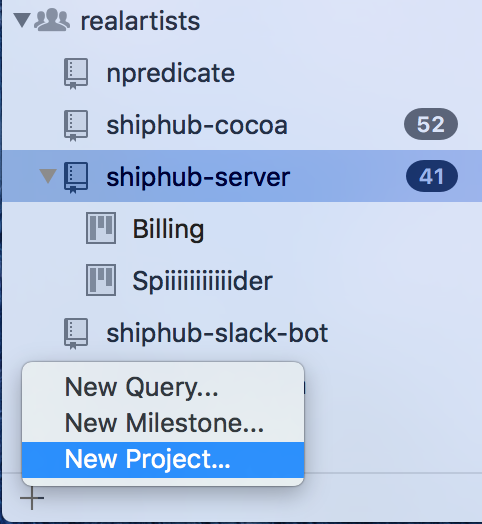
Creating New Projects
To create a new project, open the Ship Overview window (⌘0). Select the repository in the sidebar to create the project in (show the sidebar with the toggle sidebar button in the toolbar if it is not visible). Then, click the + button at the bottom left of the Overview window to create a new project.
Viewing Existing Projects
Existing GitHub projects are listed underneath their owning repositories in the sidebar. Expand the repository if it isn’t already, and click on the project you wish to view.
Deleting Projects
To delete a project, locate it in the sidebar and right (ctrl) click on it and choose Delete Project.